

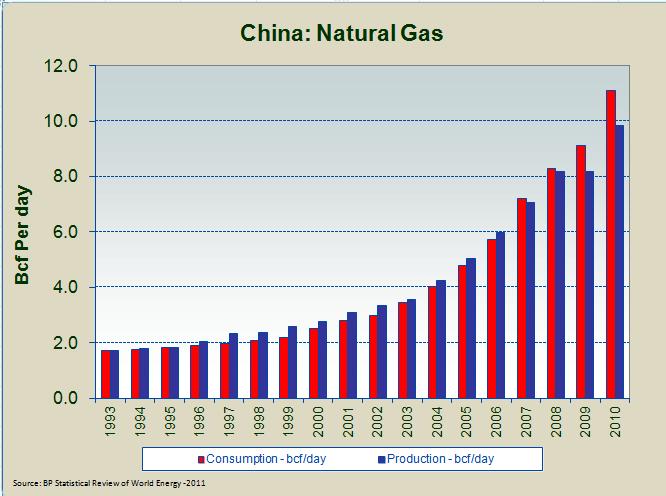
The chart to the left shows the most recent data released by BP. One noticeable difference from the prior year's data is the US surpassing Russia Natural Gas Production.
Much of the increase in U.S LNG production can be attributed to the regions like the Barnett, Haynesville, Marcellas, and Fayetville. US LNG production has increased 14 fold over the last decade. In 2010, the 30% increase in LNG production outpaced the 16% increase in consumption.

Here's a chart comparing the top oil and gas producing nations.


Consumption in he U.S and Russia grew by +5.7% and +6.3%, respectively.


 The chart to the left shows the regions responsible for the bulk of
the US Natural Gas Production. One figure that stood out was
Louisianna's YOY production increase of 45%, from 1,548.6 BCF in 2009 to
2,246.4 BCF in 2010. Note that The Gulf of Mexico production has
declined significantly over the the past decade as development of
horizontal drilling and fracture stimulation of tight gas (including
shale gas) has led companies to look onshore where they have more
consistent drilling results and returns. This caused offshore gas to
drop from about 25% of U.S supply in the late 1990's to less than 15%
today. Although this shift to resource plays required more rigs and
drilling, it ensured the companies could replace reserves at a more
knowable cost.
The chart to the left shows the regions responsible for the bulk of
the US Natural Gas Production. One figure that stood out was
Louisianna's YOY production increase of 45%, from 1,548.6 BCF in 2009 to
2,246.4 BCF in 2010. Note that The Gulf of Mexico production has
declined significantly over the the past decade as development of
horizontal drilling and fracture stimulation of tight gas (including
shale gas) has led companies to look onshore where they have more
consistent drilling results and returns. This caused offshore gas to
drop from about 25% of U.S supply in the late 1990's to less than 15%
today. Although this shift to resource plays required more rigs and
drilling, it ensured the companies could replace reserves at a more
knowable cost. 


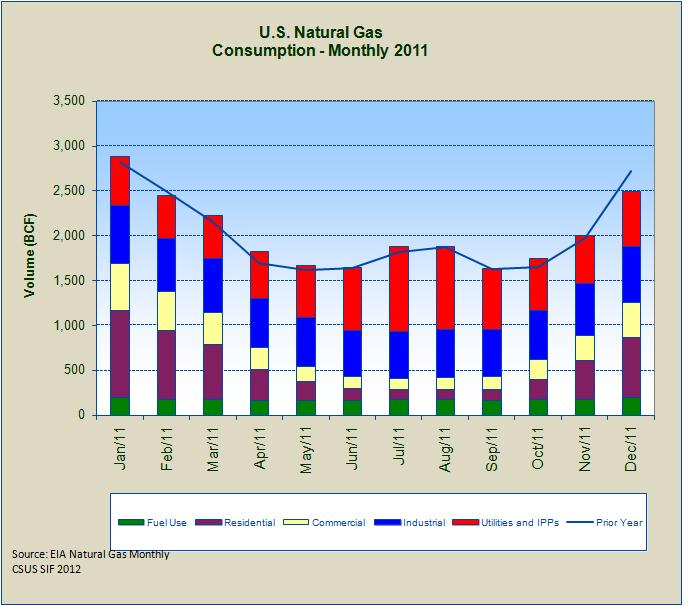
In the 6-week period from December to February, natural gas consumption is generally highest.


Natural gas inventories are well above the 5 year range.


The upward trend of natural gas used for electric generation by utilities and independent power producers as they shift away from coal.

The U.S imports the vast majority of nat gas by pipeline from Canada. Other imports arrive by cargo from the countries shown on the graph to the left. Due to significant increases U.S. production from shale plays, 2011 YoY LNG imports are down 19.1%. LNG imports from Trinidad (shown in blue) are down by over 32% YoY.
http://205.254.135.7/todayinenergy/detail.cfm?id=5410

No comments:
Post a Comment