
U.S. Crude Oil Production passes 6
million bbls/ day...
The U.S. hasn't produced at these levels since 2000. North Dakota oil production is on track to surpass Alaska and California, with Williston Basin production recently passing the 600,000 bbl/day mark. Texas is the only state likely to stay ahead as production from the Eagle Ford continues to ramp up.

Crude Oil Inventories
For the week ending May 4, 2012, excluding the SPR, crude stocks were estimated to be 379.5
million barrels, or 25.4 days worth of refineries demand.
(The SPR- Strategic Petroleum
Reserves- are 696 million barrels of oil held by the Federal Governments in case of supply
interruptions.)
Days of Refinery Demand
 The increased inventories were
mostly driven by the Gulf Coast. Shell and Saudi Aramco's 325 mbbl/d
refinery also may have contributed to the recent build due to inventory
requirements. Imports from Saudi Arabia, much of which arrive at the Gulf Coast
have also recently increased over the last month by roughly190 mbbls/d. In
addition, some refineries have conducted late season maintenance.
The increased inventories were
mostly driven by the Gulf Coast. Shell and Saudi Aramco's 325 mbbl/d
refinery also may have contributed to the recent build due to inventory
requirements. Imports from Saudi Arabia, much of which arrive at the Gulf Coast
have also recently increased over the last month by roughly190 mbbls/d. In
addition, some refineries have conducted late season maintenance.Refineries operated at 84.4% of capacity and the trend appears to be rising, which may lead to higher margins and potential opportunities in the downstream segment.
Oil Rig Count

It's interesting to see how many
more oil rigs we have today to produce the same 6 mmbbls/d produced in 2000.
As of May 11, Baker Hughes reported 1372 U.S oil rigs working. You can see
from the graph to the right that the U.S. had roughly 200 oil rigs in year 2000. The increase in drilling rigs and horizontal drilling have led to a reversal in the prior 30 year downward trend of domestic oil production.
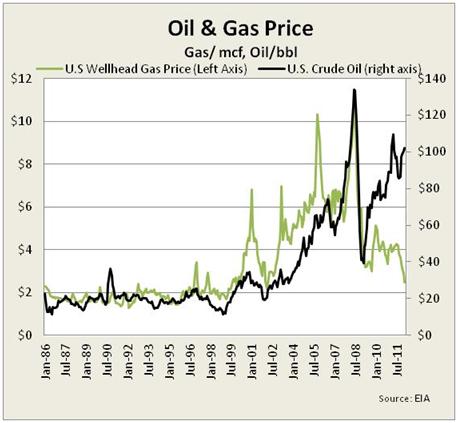 Prices
Higher crude oil prices have spurred drilling
in unconventional sources. Strong demand combined with the lack of
new conventional oil finds has spurred higher prices.
Gasoline Sales
 Over the last 4 weeks (ending 5/4/12), the U.S. consumed 34.8 million bbls of gasoline. That's a 3.3% decrease YoY.
Shown
by the squiggly red red line on the bottom of the chart to the right,
we can see how current U.S gasoline consumption is on the lower
spectrum of their historical range, partially due to energy efficiency.
 So what do most Americans do when oil/ gasoline prices rise?
They just drive less. The graph to your right shows the amount of miles driven in rolling 12 month windows since 2003.

U.S Monthly Miles Traveled
The graph to you right shows how more miles are driven during the summer.
 Higher Oil Prices= Increased Demand for Fuel Efficient Vehicles in the U.S.
Hybrid vehicle sales have also increased quite a bit as a result.
Alternative Fuel Vehicles
 And although alternative fuel
vehicles only make a very small percent of the U.S. car fleet, you can
see the vast growth in the industry via the chart to the right of current AFVs in use. Most notable is
E85, which are vehicles that take up to 85% ethanol (made from corn) mixed with gasoline. All
gasoline today is at least 10% ethanol due to the Renewable Fuel Standards act of 2005.
And although alternative fuel
vehicles only make a very small percent of the U.S. car fleet, you can
see the vast growth in the industry via the chart to the right of current AFVs in use. Most notable is
E85, which are vehicles that take up to 85% ethanol (made from corn) mixed with gasoline. All
gasoline today is at least 10% ethanol due to the Renewable Fuel Standards act of 2005.
Here's a link to view U.S. access to alternative fuel stations:
http://www.eia.gov/todayinenergy/detail.cfm?id=6050.
However, although the U.S and other countries in the OECD are becoming more fuel efficient, it's important to note the tremendous growth in non-OECD countries, particularly China and India, which more than offset the slight decrease in demand for petroleum in developed countries.
However, although the U.S and other countries in the OECD are becoming more fuel efficient, it's important to note the tremendous growth in non-OECD countries, particularly China and India, which more than offset the slight decrease in demand for petroleum in developed countries.
No comments:
Post a Comment