Saturday, May 12, 2012

Petroleum Update: Production, Inventories, Gasoline & Transportation


U.S. Crude Oil Production passes 6 million bbls/ day...
The U.S. hasn't produced at these levels since 2000. North Dakota oil production is on track to surpass Alaska and California, with Williston Basin production recently passing the 600,000 bbl/day mark. Texas is the only state likely to stay ahead as production from the Eagle Ford continues to ramp up.


Crude Oil Inventories 
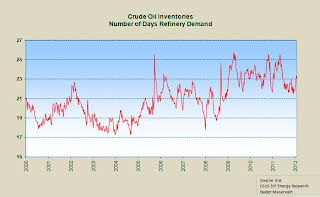
For the week ending May 4, 2012, excluding the SPR, crude stocks were estimated to be 379.5 million barrels, or 25.4 days worth of refineries demand.
(The SPR- Strategic Petroleum Reserves- are 696 million barrels of oil held by the Federal Governments in case of supply interruptions.)
Days of Refinery Demand 
The increased inventories were mostly driven by the Gulf Coast. Shell and Saudi Aramco's 325 mbbl/d  refinery also may have contributed to the recent build due to inventory requirements. Imports from Saudi Arabia, much of which arrive at the Gulf Coast have also recently increased over the last month by roughly190 mbbls/d. In addition, some refineries  have conducted late season maintenance.
Refineries operated at 84.4% of capacity and the trend appears to be rising, which may lead to higher margins and potential opportunities in the downstream segment.

Oil Rig Count
It's interesting to see how many more oil rigs we have today to produce the same 6 mmbbls/d  produced in 2000.  As of May 11, Baker Hughes reported 1372 U.S oil rigs working.  You can see from the graph to the right that the U.S. had roughly 200 oil rigs in year 2000. The increase in drilling rigs and horizontal drilling have led to a reversal in the prior 30 year downward trend of domestic oil production.


Prices
Higher crude oil prices have spurred drilling in  unconventional sources. Strong demand combined with the lack of new conventional oil finds has spurred higher prices.


Gasoline Sales
Over the last 4 weeks (ending 5/4/12), the U.S. consumed 34.8 million bbls of gasoline.  That's a 3.3% decrease YoY.
Shown by the squiggly red red line on the bottom of the chart to the right, we can see how current U.S gasoline consumption is on the lower spectrum of their historical range, partially due to energy efficiency.


So what do most Americans do when oil/ gasoline prices rise? 
They just drive less. The graph to your right shows the amount of miles driven in rolling 12 month windows since 2003.
U.S Monthly Miles Traveled
The graph to you right shows how more miles are driven during the summer.


Higher Oil Prices= Increased Demand for Fuel Efficient Vehicles in the U.S.
Hybrid vehicle sales have also increased quite a bit as a result.


Alternative Fuel Vehicles
And although alternative fuel vehicles only make a very small percent of the U.S. car fleet, you can see the vast growth in the industry via the chart to the right of current AFVs in use. Most notable is E85, which are vehicles that take up to 85% ethanol (made from corn) mixed with gasoline. All gasoline today is at least 10% ethanol due to the Renewable Fuel Standards act of 2005.
Here's a link to view U.S. access to alternative fuel stations:
http://www.eia.gov/todayinenergy/detail.cfm?id=6050.

However, although the U.S and other countries in the OECD are becoming more fuel efficient, it's important to note the tremendous growth in non-OECD countries, particularly China and India, which more than offset the slight decrease in demand for petroleum in developed countries.

Tuesday, March 27, 2012

Weekly Rig Count: Gas Rigs Continue to Drop

U.S Rig Count
 For the week ending March 23, 2012, U.S.working rigs declined by 16. The majority of these were gas drilling rigs (-11), versus oil (-4).

 Oil/-Gas Split
From the graph to the right, you can see the trend in gas rigs dropping off as persistently low natural gas prices has made drilling for dry gas uneconomical in most plays. Oil rigs now make up 2/3 of working U.S. rigs. This time of year, last year, oil rigs didn't even make up half.
YoY oil rigs are up 54%, while gas rigs are down 25%.


Major State Variances
We can see operators shifting rigs to more oily regions, like the Bakken and Eagle Ford, and out of gassy plays like in the Barnett and Haynesville.
This is putting pressure on  margins of drilling service companies.

Drilling Rigs: Company Market Share by Plays
Haynesville and Bakken
Nabors Industries (NBR) has the majority of market share in Haynesville (~30%); however, they also have the largest market share in the Bakken (~23%).
Barnett 
Patterson-UTI Energy (PTEN) has the largest market share (~30%) in the Barnett (for gas rigs).
Eagle Ford
Helmerich & Payne (HP) has the largest market share in the Eagle Ford  for oil rigs (~28%).
In the DJ Basins/Niabrara, Trinidad Drilling (TDG.T) has largest market share (~19%).
-Source: Global Hunter Securities


Friday, February 17, 2012

OPEC Increases Drilling Rigs by 45%


Production
OPEC crude output for the month of January, 2012 averaged 30.9 million barrels a day. That's about 900,000 barrels/d more than the output ceiling OPEC had originally agreed to.The graph to the right shows annual oil production by OPEC country.
According to the February OPEC Monthly Oil Report, production increased by 1.8% in 2011, to 29.8 million barrels/day.
2011 spare capacity was 4.7 million bbls/d.

Drilling Rigs
Over the last year (2011), OPEC increased drilling rigs by 155, for a total of 498 rigs. That's a 45% increase YoY.

Here's an interesting fact...
OPEC produced more oil in 2005 than in 2011, with less than half as many rigs.
Notice how in 2005, OPEC only had 237 rigs running, less than half the rig count of today.
So OPEC is drilling harder but producing less, (about 900,000 barrels/day less, comparing 2005 to 2011).

Saudi Arabia
Saudi Arabia is by far OPEC's largest producer, and second in the world behind Russia. You can view more on oil stats by clicking the "Oil" tab at the top of the page.
While reading Twilight in the Desert, by Mathew Simmons, I was led to look into a few pieces of data to try to gain some quantifiable insight on these super-giant oil fields like Ghawar.
Ghawar of Saudi Arabia, the world's largest oil field has been on production for over 60 years.  It produces approximately 5 million bbls/day, and has already produced more than 65 billion bbls. Production from this single field makes up more than half of Saudi Arabia's oil production.
During this time, Ghawar's production has been periodically ramped up to make up for shortages of other OPEC countries due geopolitical issues in order to preserve markets of developed countries, like the U.S. This seems to be a double edge sword: if they don't open the well head valves, developed countries decline and demand permanently decreases. If they do increase production, they risk overproducing the oilfield, which has damaging effects.  Doing so, decreases the life of the oilfield by bringing gas cap formations and premature water encroachment, which decreases ultimate oil recovery.
You can read about the Ghawar field here:
http://en.wikipedia.org/wiki/Ghawar_Field


According to the 2011 BP Statistical Review of World Energy, Saudi reported 264 billion barrels of proven reserves (19% of the world's supply). They produce about 9.8 million bbls/d, with the capacity to produce 12 million bbls/d.
It's interesting to note that Saudi Arabia has been stating roughly the same number of proven oil reserves for the last 10 years.
In any case, assuming the number is accurate, production stays constant, and no reserve replacements, Saudi will deplete their reserves in 74 years (264B/(9.8mmbod*365 days)=~74 years).  If they produced 12 million b/d, that number becomes ~60 years, that is assuming there really is 264 billion barrels recoverable in Saudi Arabia.

Global Perspective
Using the same assumptions, if we look at the global oil supply (1.383 trillion barrels as of beginning of 2011), and global production (83 million bbls/d), we will deplete our proven reserves in 46 years (1.38 trillion/83mil*365).


Of course, as price increases, driven by demand from developing countries like China (graph, right ), we may be able to increase the recoverable amounts via technological advances that cost more to produce but are supported by higher oil prices, which is certainly possible, as well.
So, say we found a super-giant oil field tomorrow that increased our world's recoverable oil reserves by 50%; at current production rates, that would equate to 68 years left of our global oil supply.

Again, these are based on oil production of 83 million bbls/day- which is our current global crude output (2011 BP Statistical Review).

Today, we demand 89.5 million bbls/d.  The International Energy Administration projects world oil demand to increase to 91.1 million bbls/day by the end of this year (graph, right).

As the gap between supply and demand widens in this inelastic, illiquid market, the main determinant of who gets what will be price.

These simple calculation are by no means perfect, as there are several elements that may alter the potential outcomes.  Just something I wanted to share with my fund members to help demonstrate the trends supporting higher oil prices and the vast importance of the petroleum industry in our investment portfolio, as well as in our modern society.


Monday, February 13, 2012

U.S. Weekly Petroleum and Rig Count

Crude Oil Inventories

For the week ending Feb. 3rd, crude stocks increased by 304 thousand barrels from the previous week to 339.3 million barrels or 23.1 days of refinery demand. You can see from the graph on the right that this is in the upper limit of the range for this time year.


Refining
U.S. field production increased by 43 mb/d to 5,763 mb/d.  Refiners operated at 82.8% of capacity, an increase of 1% since the prior week, as total crude inputs increased by 180 mb/d and operable capacity decreased by 6 mb/d.


Gasoline Supplied
Motor gasoline supplied continues to remain at depressed levels at approximately 8 million barrels per day. The most recent 4 week rolling period is down 6.8% YoY.


Drilling Rigs
Total U.S working rigs declined by 8 from the prior week to 1989. Gas rigs dropped by 25 while oil rigs increased by 18. Directional rigs declined by 2 and horizontal and vertical rigs declined by 3 each.


Sunday, January 29, 2012

Gasoline Consumption sinks to lowest in over 10 years

For the Week Ending January 20, 2012
Gasoline Supplied
Finished motor gasoline supplied, which approximately represents U.S. gasoline consumption, was recorded at 8.1 million barrels a day. This is a YoY 6.4% decrease from the prior 4-week rolling period. The week ending January 13, 2012, gasoline supplied dipped below 8 million barrels a day, which is the lowest level in over ten years (the last time was the week of Sept 21, 2001).  Is this a prequel to an economic slowdown?

Refinery Utilization
Refinery Utilization decreased by 254 mb/d or 1.5% from the prior week.  This is also a 6.4% decrease YoY.


Drilling Rigs
Total U.S. Rigs were recorded at 2008, +21 higher than the prior week and a 17.2% increase YoY.
Gas rigs decreased by 11 and oil rigs increased by 32, as companies are shifting to more liquid plays like the Bakken, and out of natural gas plays like the Haynesville due to the oversupply and persistently low natural gas prices.  Ceramic proppant company Carbo Ceramics (ticker: CRR), which gets a good amount of revenue from the Haynesville took a big hit last week after missing earnings.
Oklahoma added 9 rigs, most likely in the liquid rich Cana-Woodford Shale, while North Dakota, Montana, and Wyoming added 4 rigs each.

Tuesday, December 20, 2011

North Dakota Oil Production by County


North Dakota Monthly Oil Production by County
Top 5 producing counties are:
1. Montrail County, 3.999 mmbo/ month
2. Mckenzie County, 2.741 mmbo/ month
3. Dunn County, 2.063 mmbo/ month
4. Williams County, 2.025 mmbo/ month
5. Bowman County, 0.835 mmbo/ month
*Data as of 10-2011


Bakken Wells Producing & BBLs Per Well
Note the steep increase beginning in late 2004 and continuing today.


Friday, December 9, 2011

Crude Oil Update

Crude Oil Inventories

Crude Oil Stocks (excluding SPR) increased by 1.34 million barrels since the prior week of Nov. 25. The graph above shows crude oil inventories by month over the last few years.

Crude Oil Refinery Inputs 

Crude Oil refinery inputs increased by 682,000 barrels since the prior week, and by 344,000 since the same time last year.

U.S. Refinery Utilization 

U.S Capacity Utilization increased by roughly 3% to 87.7% from the prior week.

Gasoline

Motor gasoline supplied totalled 34.59 million over the past 4 weeks, down -3.4% since the same time last year and quite low compared to the last 8 years (shown above in black).

Drilling Rigs


U.S Oil Rigs continue to rise, with the latest count coming in at 1,132, up 52% since the same time last year.


The most recent rig counts:

Direction rigs: 217 (-0.5% YoY)
Horizontal rigs: 1,556 (20% increase YoY)
Vertical Rigs: 620 (17.2% YoY)